Ghidra tips
Contents
Contents:Ghidra is a software reverse engineering (SRE) framework used by MGSV researchers to reverse engineer the game. Ask for access in Modders’ Heaven discord. Don’t hesitate to share information with others, we have the same goal - make the game even better.
This page describes common techniques for working in collaboration with others.
Glossary
Production exe = msgvtpp.exe
Debug exe = Tpp_main_win64.exe
Starting
After getting connection info on Discord, select the exe you are interested in and click on checkout button - the only active button on the panel.
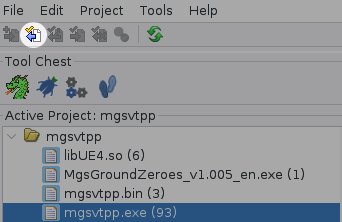
That will download the file and set you into checkout mode. Do not drag the unchecked file into decompiler window - Ghidra will do something weird instead, slowly analyzing the file every time you do it.
After checking out do whatever you wanted to do. After finishing you can check in the file or undo the checkout.
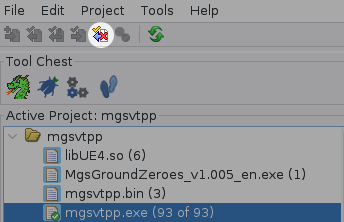
Undoing the checkout will cause Ghidra to forget about the data you downloaded.
If you made some changes, saved them and have a write access, a new version of the file will be created by checking in (indicated by number and asterisk in parentheses in project window).
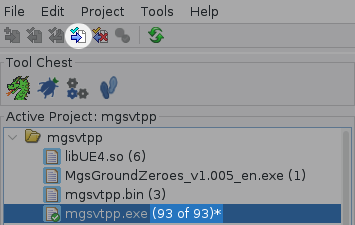
If you’ve made a mistake and realized that after saving the file (but before checking in), undo the changes by undoing checkout. You cannot revert changes in tool window (with Ctrl+Z) after saving the file.
Consult Ghidra manual (F1 -> Version Control) for more information.
Naming functions
Let’s say you are looking for something related to how soldiers respawn.
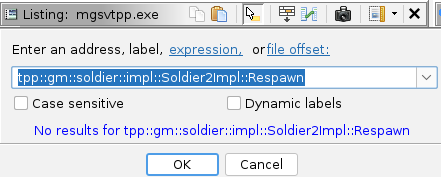
First, look for “Respawn” in debug exe:
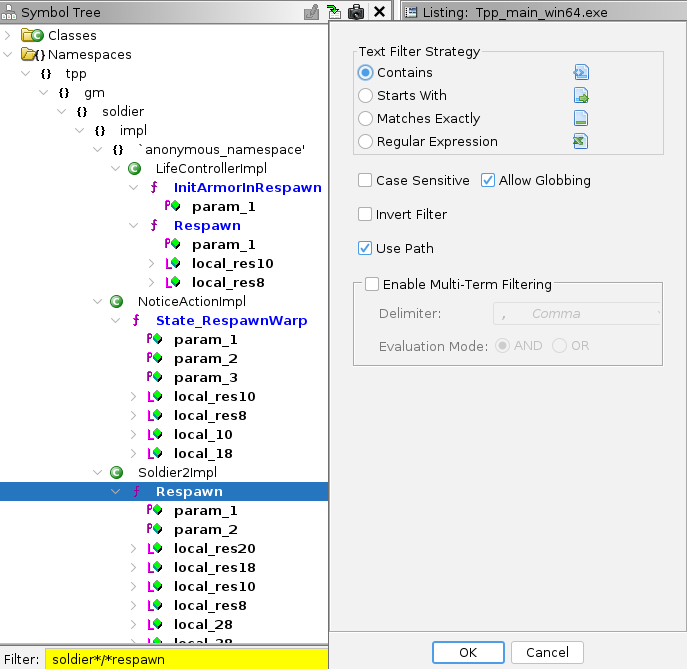
Check Use Path and Allow Globbing in filter properties (button next to filter text input), then look for soldier*/*respawn.
Use namespaces tree - it shows more info; Impl class usually has the code you are interested in.
All right, you’ve found a function in the debug exe that looks like it - tpp::gm::soldier::impl::Soldier2Impl::Respawn,
but we need the code in production executable. Load mgsvtpp.exe, press g (or Navigation -> Go To), paste full
function name and click OK.
Function was not discovered before, Ghidra doesn’t know anything about it. There are several approaches to this problem.
First is to run Version Tracking to match functions from debug exe to prod exe. That was already done before - this process runs for a long time, consumes a ton of memory and the results have to be filtered manually. In fact, ~30k functions in production exe were renamed by Version Tracking. Running it again is not advised, since there are much faster ways.
Second is to look for specific function patterns.
Function patterns
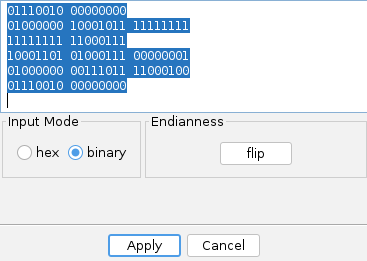
Select some code that looks unique to you in Decompiler window,
then select continuous list of corresponding instructions in Listing window. Use Search -> For Matching Instructions -> Exclude Operands.
Ghidra will automatically open a search window and form a binary string to look for. Search for it in debug exe first to
make sure that there are not too many matches.
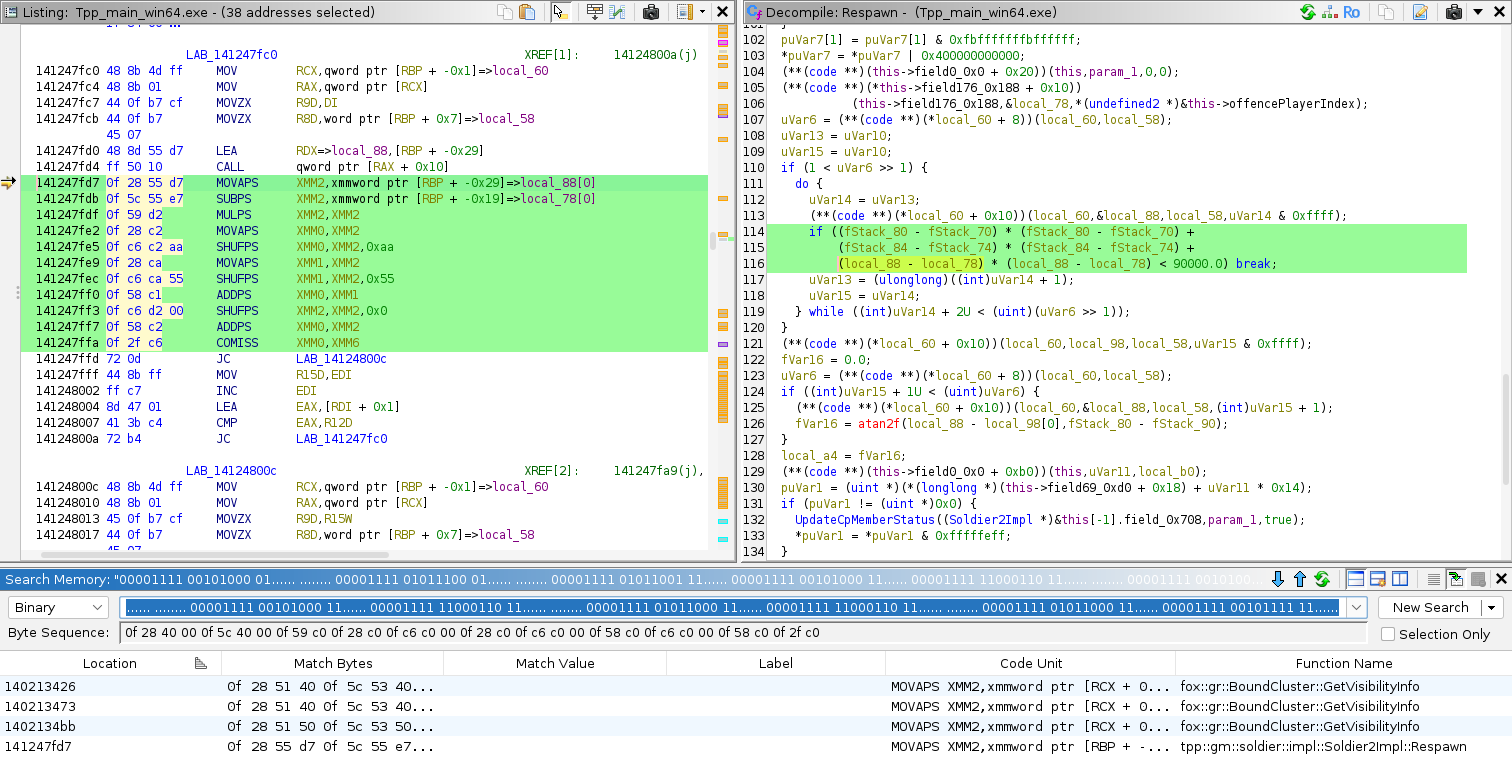
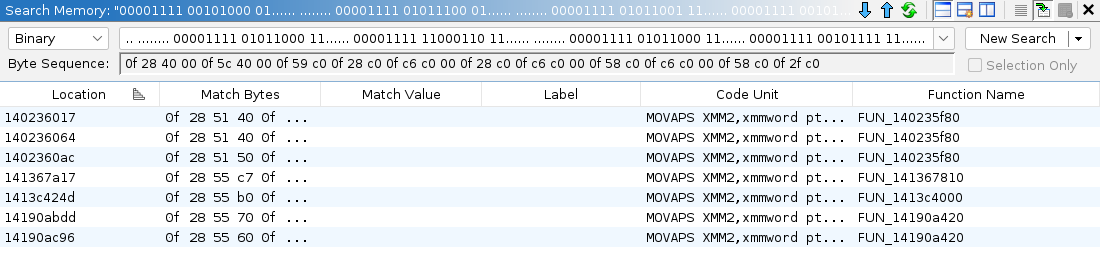
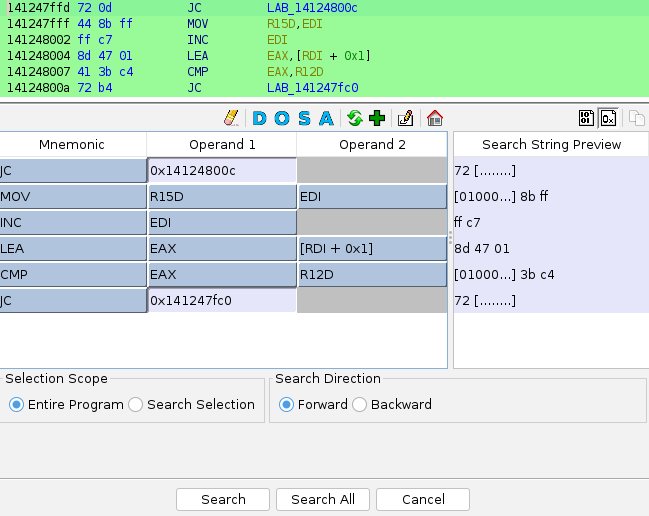
As you can see, we found 4 entries and only 2 functions. Good enough. Open search window in production exe by
pressing s, change search type to binary, paste the search string and search for it.
Now you need to compare decompiled code in debug and production exe. Usually it looks almost the same, but you must make sure that this is the same function. Giving function a name adds context that will be used by other people; adding wrong context will misguide and confuse them, effectively losing hours of work.
If function decompilation listing matches in both exes, copy full name of the function from debug exe: tpp::gm::soldier::impl::Soldier2Impl::Respawn.
In production exe we matched against FUN_141367810, which has same amount of parameters, both reference
other named functions in same places. Put cursor on function name in Decompile window and press l (right click ->
Rename Function). Paste full function name into name field, set namespace to Global. Ghidra will automatically
create proper namespaces for you; do not create namespaces by hand - this results in weird side effects.
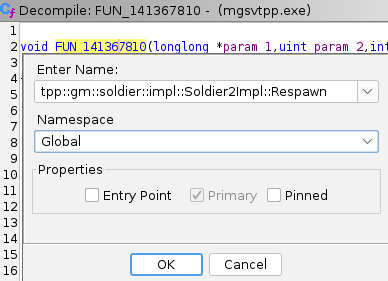
Now the function is properly named. Save the project by pressing Ctrl+S (and do it often).
You may change parameter types by right-clicking on function name and selecting Edit Function Signature. This is not
a required step; most of the types don’t have proper definitions, so changing types may distort decompiled view to the
point beyond recognition. It will also change decompilation view of other functions, so don’t do that unless you really
need it. You can rename the variable instead, adding the type in it.
Issues
Let’s say function looks almost the same, but you are not sure. Do NOT rename it just yet - you might be wrong and
it will cost you a lot of time. You can select another chunk of that function and search for it. If there is a match
in the same function, most likely you’ve found it. Still hesitate? Rename the function, but add _MAYBE suffix to
indicate some uncertainty to others. Do NOT make up function names and namespaces, this leads to confusion. Leave
a comment might be a soldier respawn function, but do not rename the function to solly::RefillHealthAndChangePosition.
There is no need to sign the comment with your name, it is saved in History automatically.
Pattern matching
Another problem: function has some weird patterns that do not match at all. You can fine-tune search pattern:
Search -> For Instruction Patterns.
Click on Enter bytes manually icon (paper with pencil, left to home button, second on the right). Copy binary code,
close the window.
Open search pattern window in prod exe, paste copied bytes into same window. Addresses in prod and debug exes differ, so you must exclude them by clicking on them. Registers may be different too, mnemonic stays the same.
After tuning the pattern, click Search All, look through the results, compare them etc.
Vtables
All right, pattern matching failed too. Third approach is vtable entries. Select the function in Listing window and
click on the first XREF (or thunk function (with (T))). Usually it points to the function reference in class’ vtable.
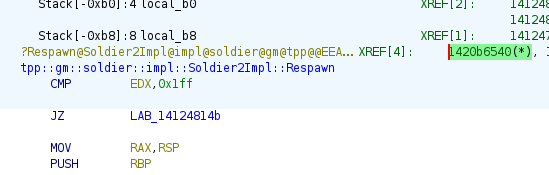
Look for Soldier2Impl in prod exe, select some function (tpp::gm::soldier::impl::Soldier2Impl::Authorize) and
navigate to its position in vtable:
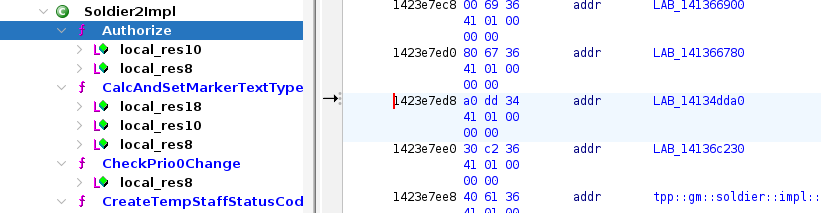
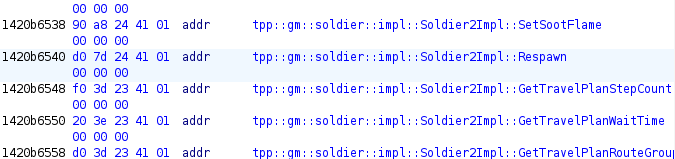
Find same function in debug exe, navigate to vtable.
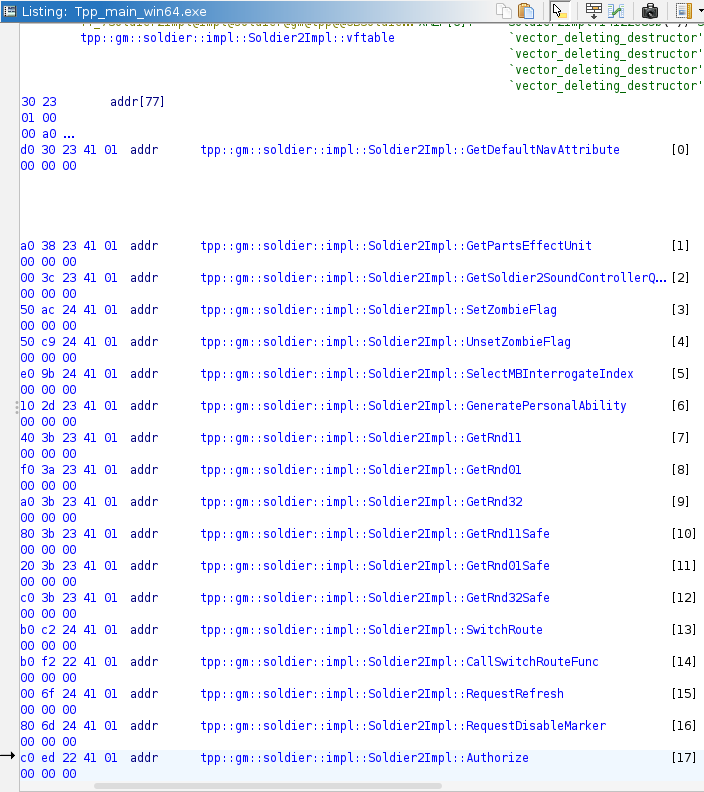
Authorize is #17 and Respawn is #55. They should be in the same position in production exe. Scroll production vtable
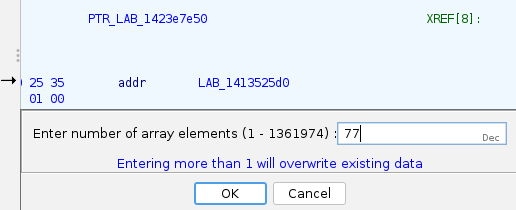
to the beginning, usually it has a label and referenced in other places. Create an array
(right click -> Data -> Create Array) with same size as vtable in debug exe:
Navigate to entry #55, compare decompiled code, etc. Once again, make sure that code matches - production exe differs from debug exe, some code was added and some removed. Vtable function order is not guaranteed, mistakes were made.
References
Look for referenced functions. For example, Respawn uses UpdateTravelWithInstanceIndex function. If it is already
named in production exe, you can compare XREFs between exes. Amount of references and their order is not guaranteed to
be the same.
When everything else fails
Take a break, think of different approaches. Your function might’ve been inlined by compiler in other function or just removed from production exe.
Tracing
Sometimes you need a bigger picture of things, like where and when is this function called? A lot of functions are not called directly, a vtable call is made instead.
Let’s use tpp::gm::player::impl::UiControllerImpl::Update function as an example. It runs in a loop doing player UI
things; it also has no direct references. This function is located at 0x140fe9630. Launch your debugger, I use
x64dbg. Ghidra’s debugger has serious UI issues - hangs / eats memory, so just
avoid it. Start the game in the debugger, add a breakpoint at 0x140fe9630 and wait for it. After breakpoint was
triggered, get a stacktrace (printstack in Log tab):
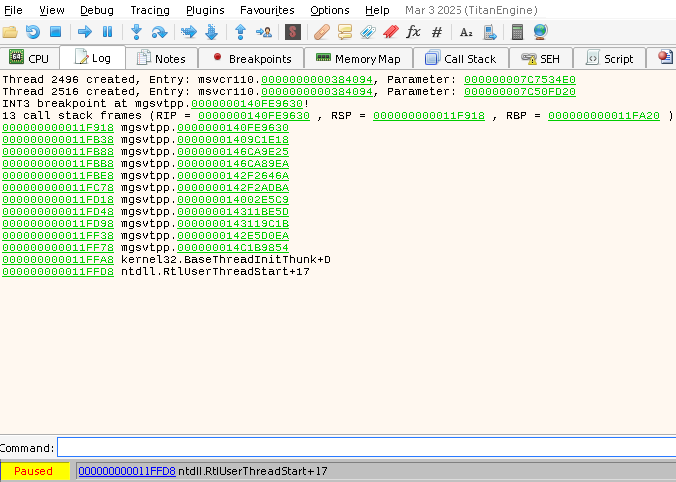
There are no function names, only addresses. Copy stacktrace and save it into a file, I use C:\stack.txt.
Open Jython console in Ghidra (Window -> Jython) and paste the script:
def stack():
	f = open("C:\\stack.txt", "r")
	lines = f.readlines()
	f.close()
	for line in lines:
		if line == "":
			print
			continue
		if "INT3" in line:
			print
			continue
		if "mgsv" not in line:
			print(line.rstrip(""))
			continue
		parts = line.split(".")
		symaddr = line.split(" ")
		addr = toAddr(parts[1])
		fname = getFunctionAt(addr)
		if not fname:
			fname = getFunctionBefore(addr)
		print("\t" + symaddr[1].rstrip("\n") + " = " + fname.getSymbol().getObject().toString())
Change C:\\stack.txt to whatever file path you saved your stack into. Then, call stack() function:
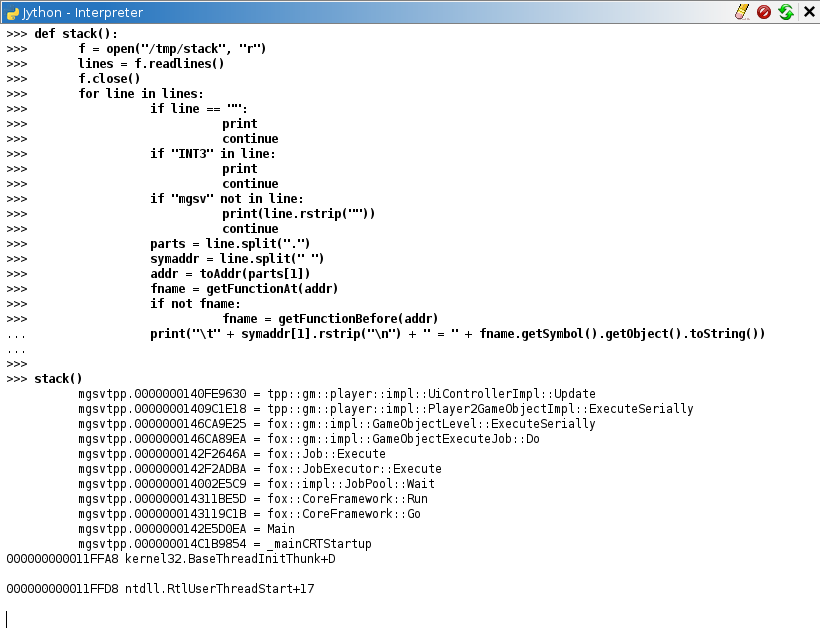
All functions are already named, so you get a nice stacktrace:
	mgsvtpp.0000000140FE9630 = tpp::gm::player::impl::UiControllerImpl::Update
	mgsvtpp.00000001409C1E18 = tpp::gm::player::impl::Player2GameObjectImpl::ExecuteSerially
	mgsvtpp.0000000146CA9E25 = fox::gm::impl::GameObjectLevel::ExecuteSerially
	mgsvtpp.0000000146CA89EA = fox::gm::impl::GameObjectExecuteJob::Do
	mgsvtpp.0000000142F2646A = fox::Job::Execute
	mgsvtpp.0000000142F2ADBA = fox::JobExecutor::Execute
	mgsvtpp.000000014002E5C9 = fox::impl::JobPool::Wait
	mgsvtpp.000000014311BE5D = fox::CoreFramework::Run
	mgsvtpp.0000000143119C1B = fox::CoreFramework::Go
	mgsvtpp.0000000142E5D0EA = Main
	mgsvtpp.000000014C1B9854 = _mainCRTStartup
Addresses are off by one instruction. Navigate to 0x1409C1E18 in Player2GameObjectImpl::ExecuteSerially, move one
instruction up and leave a Pre Comment on CALL instruction (; button or right-click -> Comments -> Set Pre Comment).
Other types of comments are either too big (like plate) or have bad visibility (end of line).
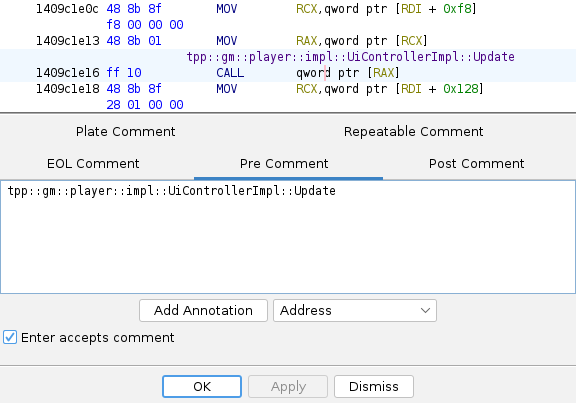
Now vtable calls in ExecuteSerially are documented:
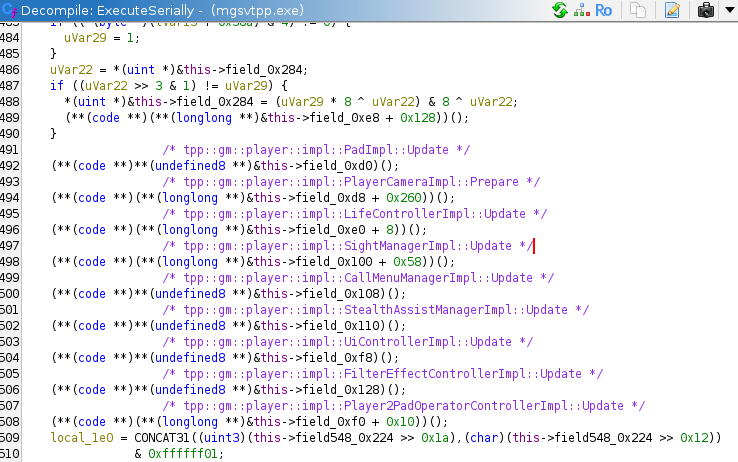
Make sure you put the comment on CALL instruction - Decompile window may put comment text somewhere else,
it must not be trusted. Do not use Decompile window to select addresses, it selects too much:
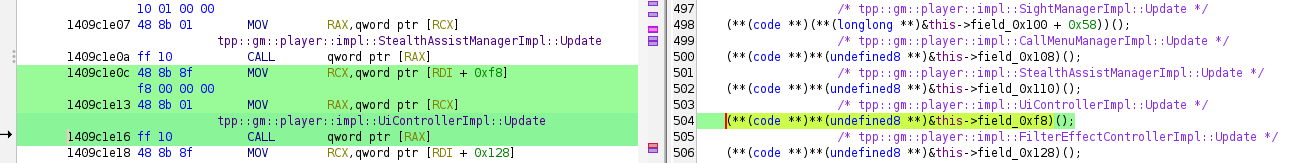
Function name comments in Listing window are clickable as long as they are fully displayed (not truncated);
you can use them to navigate between functions.
If some functions in your stacktrace are not named, be a gentleman and try to name them using methods above. You can
also check where other CALL instructions in this function point to, adding more documentation. If destination function
is not named, leave a comment with unresolved function name - better than nothing:
    uVar29 = *(uint *)&this->localPlayerID;
                    /* FUN_14963f770 */
    lVar13 = (**(code **)(**(longlong **)&this->field_0x80 + 0x10))();
    local_198._12_4_ = 0;
Assigning proper names
Production exe was researched in Ghidra before the debug exe so there are some made up namespaces and names. You can (and you should) name them properly - just like in debug exe.
An example:
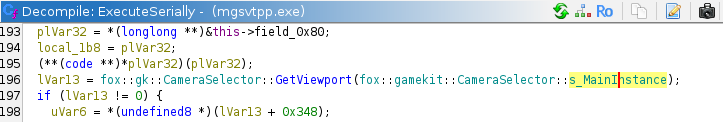
fox::gamekit::CameraSelector::s_MainInstance is not a real variable name. Debug exe has a proper name
for it: fox::gk::CameraSelector::s_mainInstance. Let’s rename it by pressing l:
Make sure to set namespace to Global, otherwise new namespace will be added to old one.
Naming constants
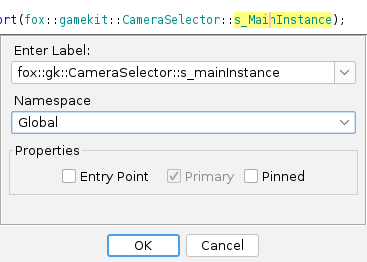
Let’s say you are looking for a StrCode32 message “PlayerDamaged”. Press s to open search window, select
“Hex” format, look for 45fdf281 - one match found in tpp::gm::player::impl::DamageControllerImpl::AdjustDamageReaction.
You might be tempted to set that hex value to “PlayerDamaged” string using right click -> Set Equate, so decompiled
view would be more readable.
This is a bad idea for two reasons. First, Ghidra takes a lot of time renaming that hex in the whole project - it
takes tens of minutes, locking ui. Second, it adds more confusion - searches usually start with hex value, but there is
no hex in Decompile and Listing windows anymore, just some text, forcing you to recheck that string. Better solution
is to leave a pre comment as seen on screenshot above. You can search for comment text using Search -> Program Text
window and limiting it to comments.
Repairing flow
Sometimes, your stacktrace might point to some garbage area without any code. In that case hold “Shift” and click on “F” button on the toolbar:
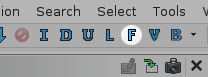
It will navigate you to the closest function above that point in code. Most likely that function will appear to be
shorter than expected, breaking on fox::SharedString::~SharedString or EntityPtr::Set. Listing window looks like this:
       14d46ed26 e8 b5 e6        CALL       fox::SharedString::~SharedString
                 ba f2
                             -- Flow Override: CALL_RETURN (CALL_TERMINATOR)
       14d46ed2b 90              ??         90h
       14d46ed2c 48              ??         48h    H
Right-click on that CALL instruction and choose Modify Instruction Flow. Set it to Default and press “OK”. Now
you can see more code in Decompile window. Put cursor on the next instruction (14d46ed2b) and press d
to disassemble the bytes. Finally, navigate to the beginning of the function, right-click on it and select
Function -> Re-create Function. That will repair navigation desync between listing and decompile windows.
Byte disassembly doesn’t always result in meaningful data; you may be disassembling some binary data instead. If
data doesn’t make any sense, undo the procedure by pressing Ctrl+Z. Do not blindly change the flow, sometimes
Ghidra does the right thing and function ends where it ends.
Labels in vtables
Vtables usually contain addresses of thunk functions that lead to real functions:
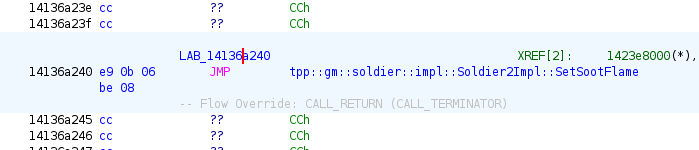
Instead of renaming the label, turn it into a thunk function by pressing f on it:
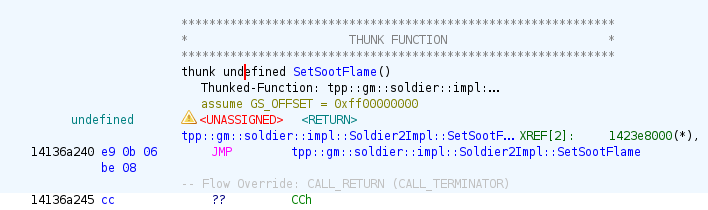
It will automatically add comments, rename the label and do things right from Ghidra’s point of view.
Code history
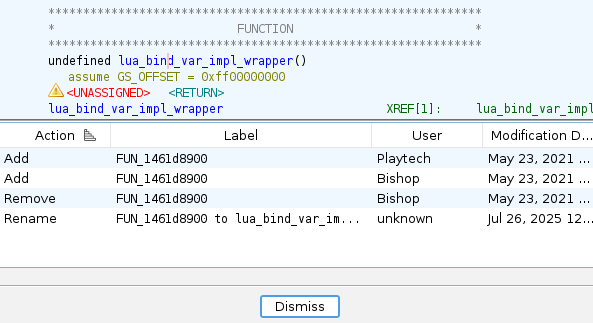
Right click on instruction in Listing window, select Show Label History.
x64dbg on Linux
Install protontricks, run it, select MGSV:TPP. Select default prefix, run debug console,
navigate to x64dbg.exe and run it: wine x64dbg.exe.
Faster alternative:
protontricks-launch --appid=287700 <path to x64dbg.exe>
Xbox360
Use X360 XEX Loader for binary analysis.